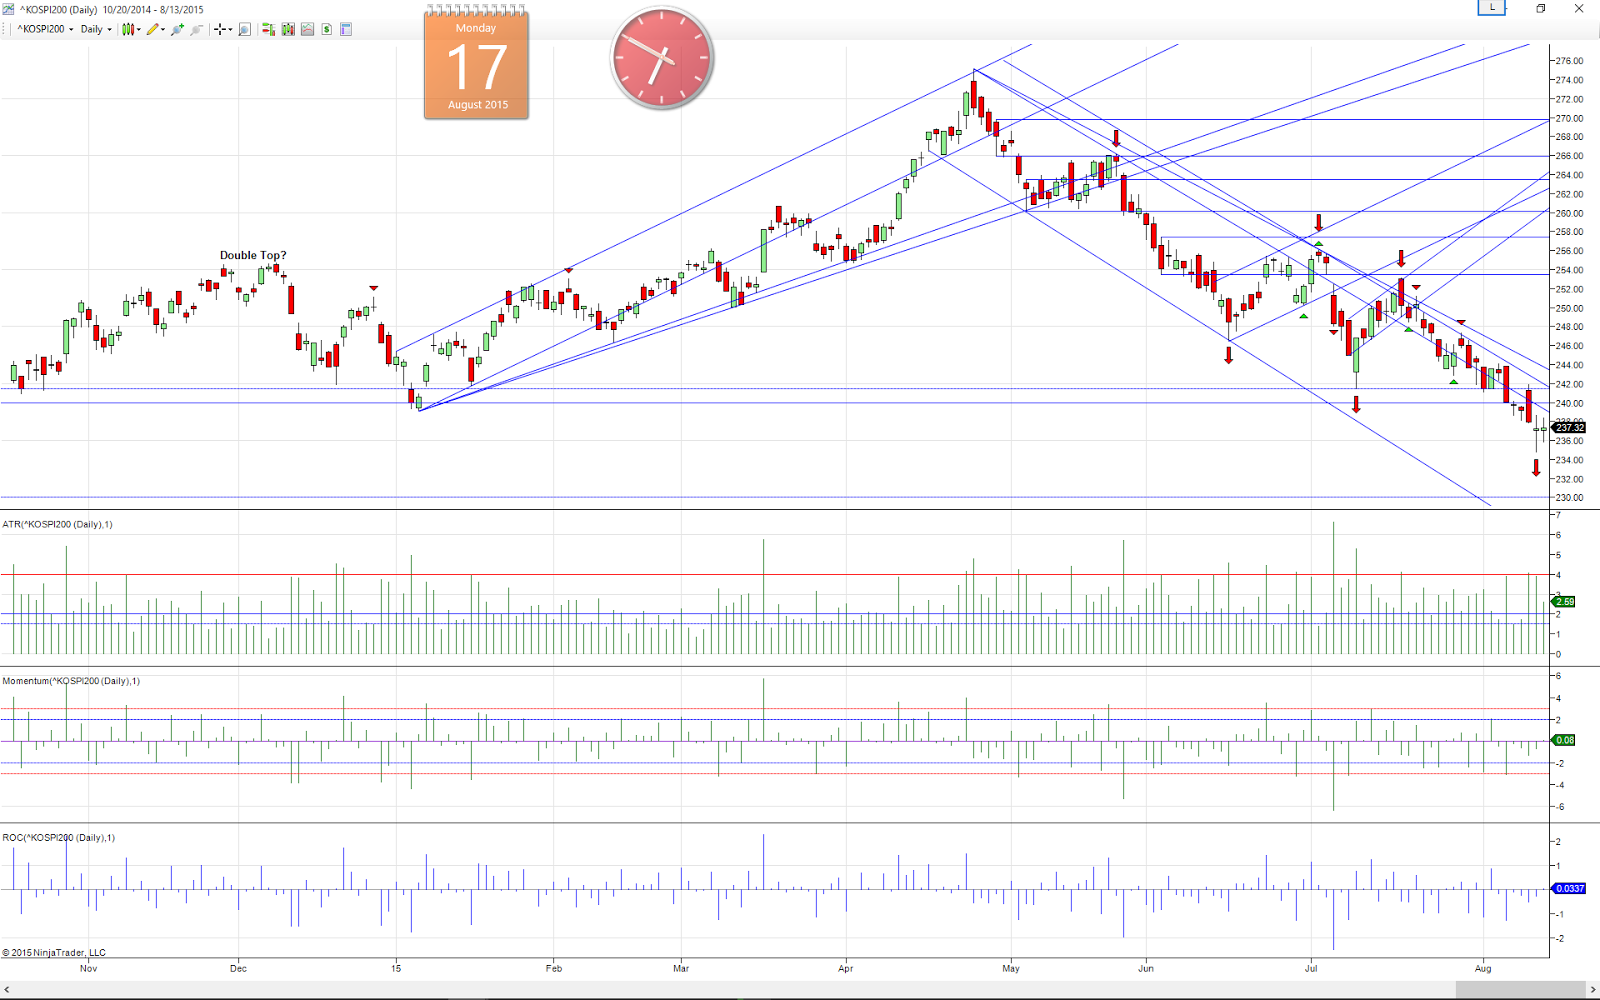
Daily : Downtrend. Lower High Lower Low.
K200 ended slightly lower this short week (4 trading days), with a pause at last 2 trading days.
MACD are still heading down.
Daily remains bearish, with a small probability of retracement up.

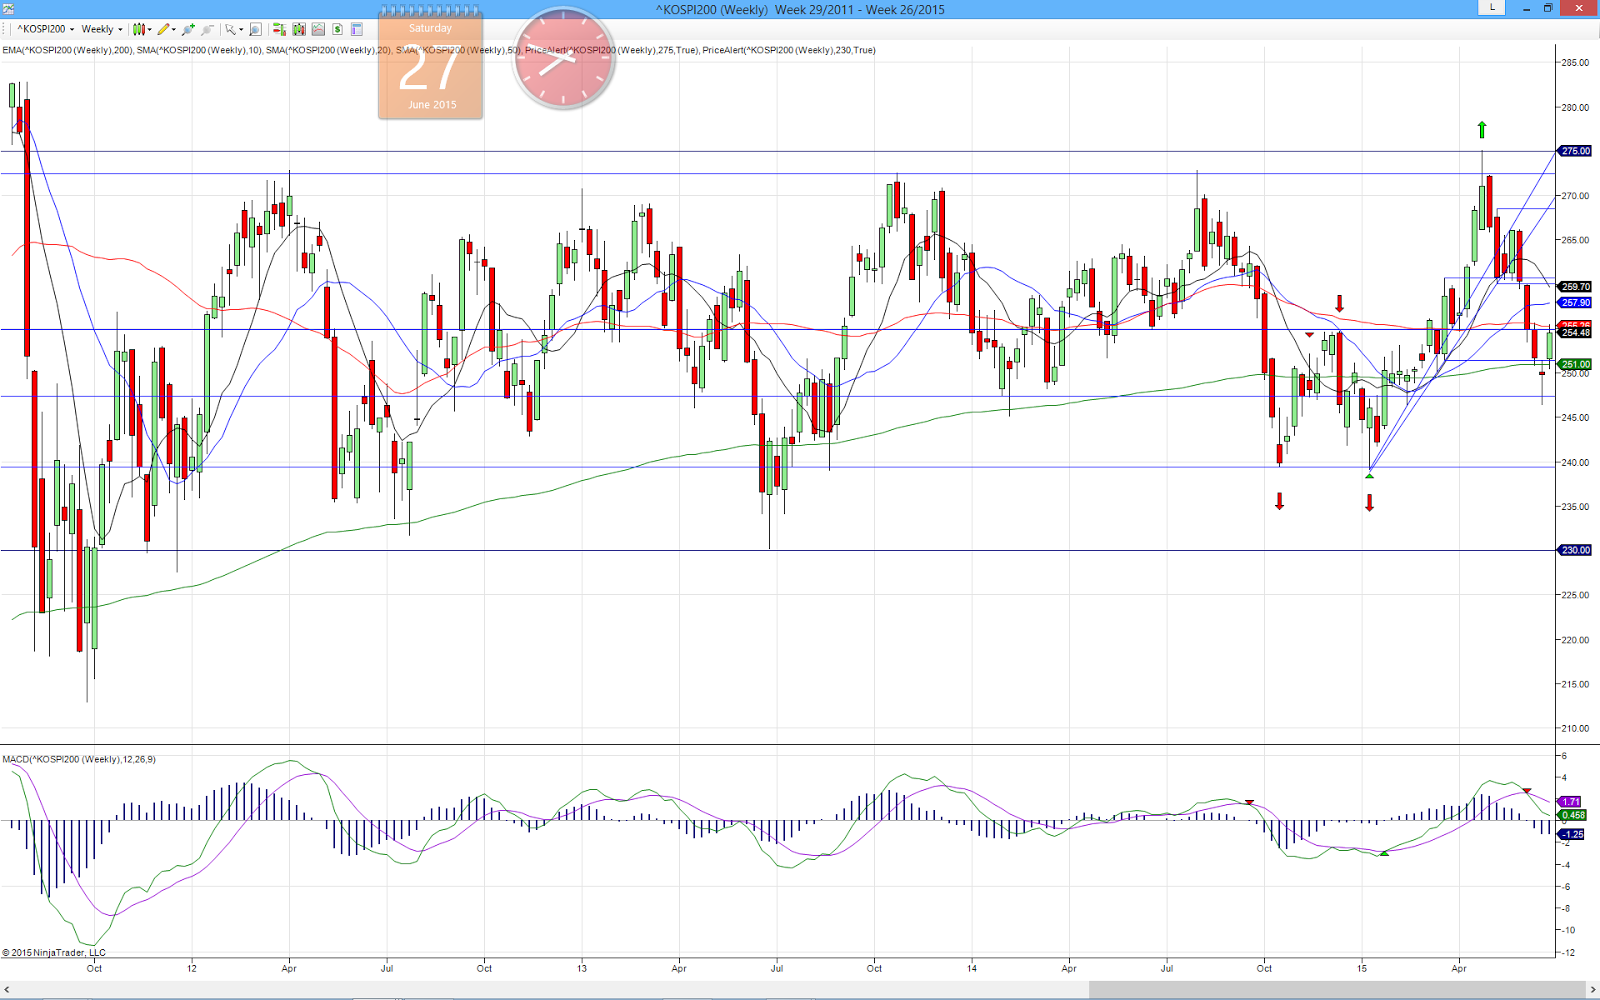
Weekly :Sideway. Short-term Downtrend.
This week bar reflect the same pause as in daily.
MACD continues to head down and widening.
Weekly remains bearish.

Monthly : Sideway. Short-term Downtrend.
240 support is broken. Next support 230. This new month bar is bearish for now. Until we get a positive sign, it is still short-term downtrend.