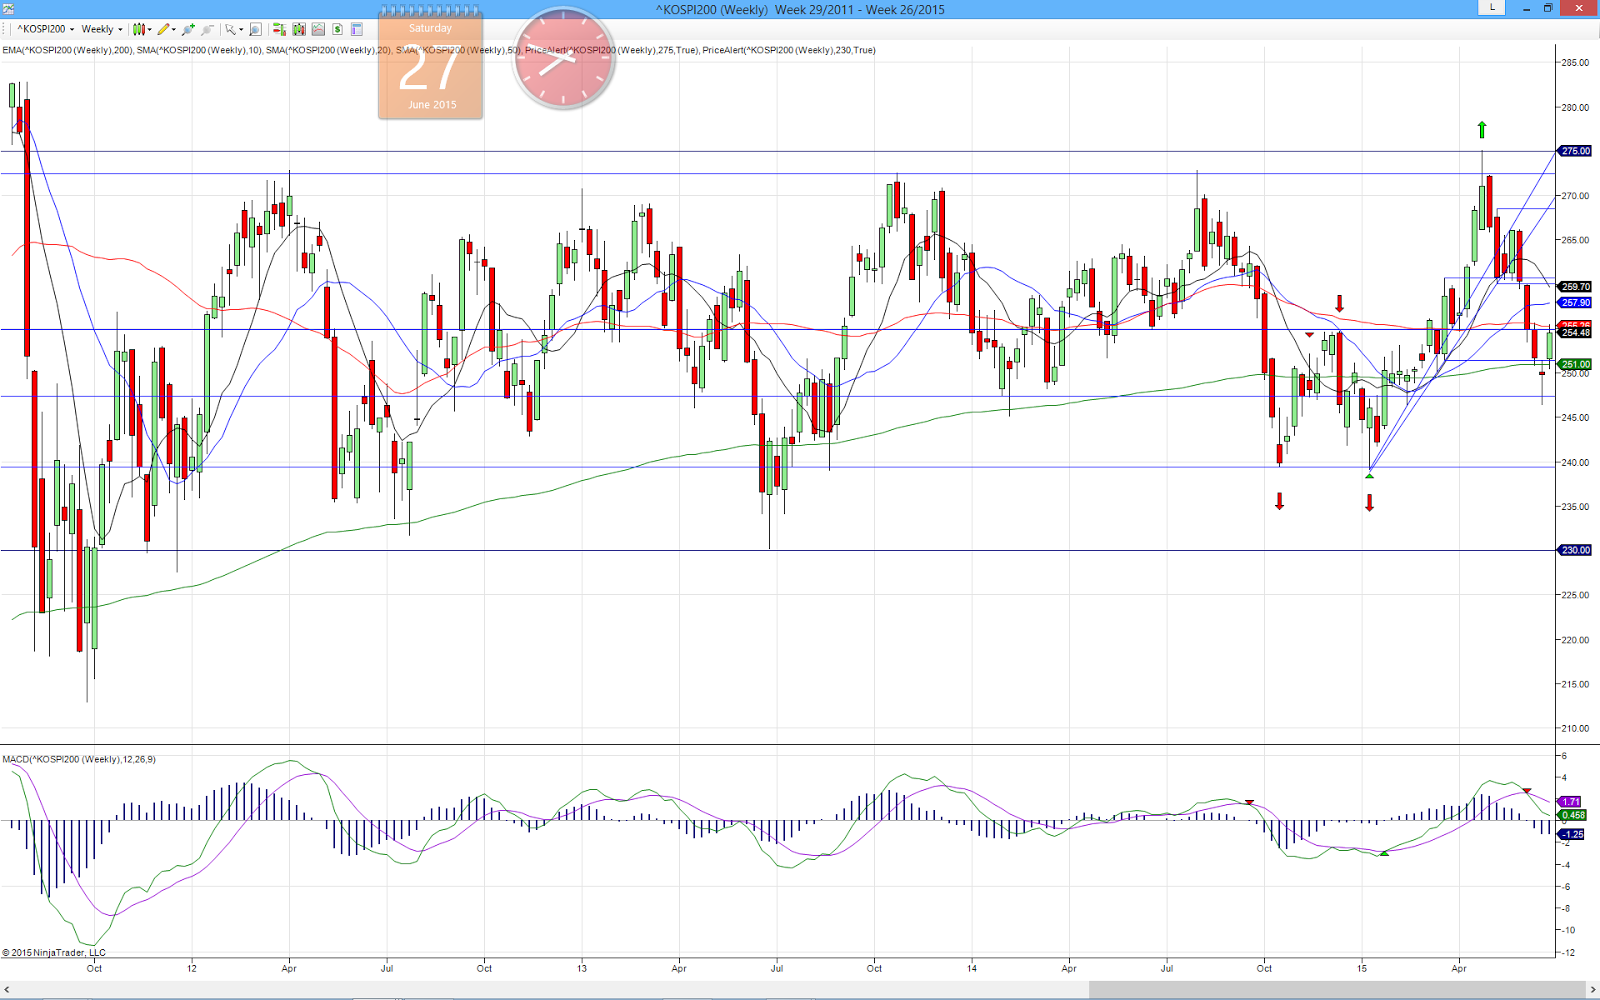
- Lower high lower low. K200 stop the down move and starts to retrace. However, the retracement has not hit any higher high. So, it is still in downtrend.
- K200 stop just below the downtrend line, which happen to be around Fibo 61.80% level, also happen to be below the resistance line of 254.68.
- MACD cross up in this week and heading up wide. It is still below MA200.
- We will need to see if K200 break above the downtrend line next week, that will be bullish. Or if it move down and it establish a higher low (means it might retrace up further), that will also be bullish. Or it establish a lower low (means it continue its downtrend move), that will be bearish.


Weekly : Sideway/Uptrend/Downtrend.
- Weekly chart is not so conclusive. On the very short term, it is downtrend, if you consider the last green bar (which is an inside bar) a few weeks ago as lower high, we do have lower high lower low.
- However, if you look at a longer term, from the double bottom, K200 has establish a higher high (green arrow). The recent pin bar is a higher low. So, we have a higher high higher low, uptrend.
- But, if you look at the whole chart, K200 has been moving between 230 to 272/275 since end 2012. It is sideway.
- K200 ended this week with a bullish bar. With the long pin bar last week, this development is bullish.
- It also move back up and stay above MA200. It might test MA50, which is just slightly above it.
- MACD though is heading down, but has stopped opening wide.
Monthly : Sideway.
- K200 continue to move up above and close above the uptrend line. The bearish bar last week has started to develop into a pin bar. With 2 more trading days to move, this month bar might not be so bearish.

No comments:
Post a Comment