Showing posts with label Trading Journal. Show all posts

Tuesday, October 28, 2014

November 2014 Nikkei 225 Iron Condor Adjustment#2

On Oct-29, 
  1. I closed the Put Spread at 7 as it reach 50% target credit in just 3 days.  Took in profit of JPY 40,000 (15-7 * 5 * 1000)
  2. I also close the Call Spread at 46 as its Delta hit 25.  Took in lost of JPY 150,000 (46-16 * 5 * 1000).
  3. I sold 10 Call Spread at 13 at Delta 8.6.  Took in credit of JPY 130,000 (13 * 10 * 1000)
  4. I also sold 5 Put Spread at 13 at Delta 8.7.  Took in credit of JPY 65,000 (13 * 5 * 1000)

I sold the 10 Call Spread as part of the adjustment I mentioned earlier.

I sold 5 Put Spread as part of the adjustment.  However, I didn't sell 10 Put Spread because
  • I am worried there might be a retracement after today run
  • I want to sell Put Spread on a down day
  • I want to sell Put Spread when volatility goes up 
So, I leave another 5 contract Put Spread for another day.

The Iron Condor is now 14250/14500/16375/16625.

Credit received : JPY 195,000 (130,000 + 65,000)
Max risk: JPY 2,305,000 (10 * 250 * 1000 - 195,000)
Margin: JPY 1,000,000 (~ USD 10,000)
Days to expiration (DTE): 16


N225 Nov2014 Iron Condor Profit/Loss : JPY -80,000 (30,000 + 40,000 - 150,000)

Related Posts:

Sunday, October 26, 2014

November 2014 Nikkei 225 Iron Condor Adjustment

On Oct-27, I closed the Put Spread at 4.  Took in profit of 6 (JPY 30,000).  I immediately sold another Put Spread 14125/13875 at 15 (JPY 75,000).

Details:
N225 at 15348 (1223 points 7.96% downside)

Sell N225 October 14125 Put at 43 
Buy N225 October 13875 Put at 28 

Credit received : JPY 75,000
Days to expiration (DTE): 18


The reasons I close the Put Spread are:
1. It reached almost of project target of 70%.  Originally intention was to have IB auto close at 3 (1 point lower than the limit set as stated in this post).  Somehow, this round IB close at the limit set, 4.
2. At Delta 3 or 2, Spread value of 3 or 4, it no longer provide any protection for the Call Spread if N225 continues to go up.
3. To bring in more credit in anticipation of Call Spread adjustment.

I normally don't roll up when the DTE is less than 30.  However, the Dec Put Spread with Delta 9-10 was not attractive.

The Iron Condor is now 13875/14125/16000/16250.

Credit received : JPY 155,000 (75,000 + 80,000)
Max risk: JPY 1,0950,000
Margin: JPY 500,000
Days to expiration (DTE): 18


Thursday, October 16, 2014

November 2014 Nikkei 225 Iron Condor

On Oct-16, I sold an Nikkei 225 (N225) Iron Condor 13000/13250/16000/16250 when N225 was at 14739.

Details:
Buy N225 October 16250 Call at 18 
Sell N225 October 16000 Call at 34 

N225 at 14739 (~1261 points 8.56% upside; 1489 points 10.10% downside)

Sell N225 October 13250 Put at 65 
Buy N225 October 13000 Put at 55 


Credit received : JPY 130,000
Max risk: JPY 1,120,000
Margin: JPY 500,000
Days to expiration (DTE): 29


Sunday, September 21, 2014

Add November 2014 N225 Call Spread

Sep-19, I sold a N225 Call Spread 17375/17625 when N225 was at 16274.20.

Details:
Buy N225 October 17625 Call at 35 (Delta: 0.0792)
Sell N225 October 17375 Call at 50 (Delta: 0.1187)

N225 at 16274.20 (~1100 points upside)

Credit received : 20 (JPY 20,000)
Max risk: 230 (JPY 230,000)
Margin: JPY 100,000
ROM: 20%
Days to expiration (DTE): 55

Below is the chart as at close of Sep-19:


This the P&L Chart as at close of Sep-19:


Saturday, September 20, 2014

Mistakes made in Cutting Loss

At 8:10am,  N225 was at 16,178.32, Delta was at 0.2394.  Bid-Ask spread was 43-37, 6pt spread.
The minimum fluctuation is 1pt for 50pt or less and 5pt for over 50pt up to 1,000pt.


At 8:39am, after sending kids to school, N225 went up 20pts to 16,198.84, Delta was at 0.2512, Bid-Ask spread was 46-40.  Base on last close price 80-34, the spread was 46.  Loss is 228% of credit (46 minus credit of 14 divide by 14).

Base on the criteria (Delta > 0.25 or/and Loss > 200% of creidt) in my Exit Strategy, I should close this call spread immediately, for Stop Loss or for Adjustment.

I didn't!  I spend the next hour trying to determine what contract to roll out & up.  Well, I have long determined in my weekly review that I will not just roll up to current month as the DTE is too short.  I will roll out to next month, November contract.  However, I have not determined what Strike price to roll up too.

Worst!  Besides looking at what Call Spread to roll out to, I was also looking at what Put Spread to form Iron Condor.

By 9.43am, N225 went up more than 80pts to 16,282.92.  At this point, N225 is up 216pts!  Delta was at 0.3012, Bid-Ask spead was 59-53.  Base on last close price 105-47, the spread was 58.  Loss is 314% of credit.


While I managed to close at 55 as written in this post, it was lucky as there was a dip/retrace when I tried to cover in separate legs.  Not a repeatable process.

At 12.15pm, N225 went up to 16,361.86.  The spread had also gone up and widen to 75-65, 10pts spread because the 16,750 Call price went up above 50pts.


Conclusion
1. The first cut loss is always the best cut loss
If I had cut loss at 8.39am, when both criteria hit, I could sell the spread at 46 (suffered 6pts spread).  The loss will be 32pts (JPY 32,000), 228% of credit.

2. Focus on closing the loss position
I should spend time closing the loss position instead of rolling/adjusting.  Cut loss should execute fast while new position should always take time to find best opportunity.  Juggling between cutting loss and opening new position simply didn't work.  Time is not on our side.

3. Should I cut loss on the loss leg first?
In the Call Spead, it is the Short leg that is suffering the loss.  If I have cut the loss leg first at 80 (buy at Ask price), I sell the Long leg later at 60.  The spread will end up at 20.  The loss will be 42% of credit (20 minus credit of 14 divide by 14).
This idea is yet to be explored before it is put in Trading Plan.

Thursday, September 18, 2014

Close October 2014 N225 Call Spread of Iron Condor

On Sep-19, I closed the N225 October 2014 Call Spread of Iron Condor 13250/13500/16500/16750.

Details:
Sell N225 October 16750Call at 50
Buy N225 October 16500 Call at 105

Note: All calculation before commission
Credit received : 14 (JPY 14,000)
Credit paid : 55 (JPY 55,000)
Loss : 41 (JPY 41,000), 293% of Credit
Margin : ~JPY 100,000 for full Iron Condor
Loss On Margin (LOM) : 41% or 82% for full Iron Condor or half Iron Condor respectively
Days on Trade : 39


Close October 2014 K200 Put Spread of Iron Condor

Sep-19, I closed the K200 October 2014 Put Spread of Iron Condor 247.5/250/277.5/280.

Details:
Buy K200 October 250 Put at 0.17
Sell K200 October 247.5 Put at 0.13

Note: All calculation before commission
Credit received : 0.20 (KRW 100,000)
Credit paid : 0.04 (KRW 20,000)
Profit : 0.16 (KRW 80,000), 80% of Credit
Margin : ~KRW 1,000,000 for full Iron Condor
Return On Margin (ROM) : 8% or 16% for full Iron Condor or half Iron Condor respectively
Days on Trade : 30

Thursday, September 4, 2014

November 2014 K200 Iron Condor

Sep-4, I sold a K200 Call Spread 280/282.5 when K200 was at 263.42.

Details:
Buy K200 October 282.5 Call at 0.43 (Delta: 0.0770)
Sell K200 October 280 Call at 0.63 (Delta: 0.1076)

K200 at 263.42 (~16 points upside)

Credit received : 0.2 (KRW 100,000, before commission)
Max risk: 2.30 (KRW 1,150,000)
Margin: KRW 1,000,000
ROM: 10%
Days to expiration (DTE): 71


With the Sep-3: November 2014 K200 Put Spread, it forms an Iron Condor


Details:
Buy K200 October 282.5 Call at 0.43 (Delta: 0.0770)
Sell K200 October 280 Call at 0.63 (Delta: 0.1076)

K200 at 263.42 (~16 points upside) on Sep-4
K200 at 262.26 (~17 points downside) on Sep-3

Sell K200 October 245 Put at 0.78 (Delta: 0.1061)
Buy K200 October 242.5 Put at 0.59 (Delta: 0.0854)

Total Credit received : 0.39 (KRW 195,000, before commission)
Max risk: 2.11 (KRW 1,055,000)
Margin: KRW 1,000,000
ROM: 19.5%
Days to expiration (DTE): 71

Below is the chart as at close of Sep-4:


This the P&L Chart as at close of Sep-4:


Wednesday, September 3, 2014

November 2014 N225 Call Spread

Sep-3, I sold a N225 Call Spread 17250/17500 when N225 was at 15795.71.

Details:
Buy N225 October 17500 Call at 33 (Delta: 0.0702)
Sell N225 October 17250 Call at 50 (Delta: 0.0974)

N225 at 15795.71 (~1454 points upside)


Credit received : 17 (JPY 17,000)
Max risk: 233 (JPY 233,000)
Margin: JPY 100,000
ROM: 17%
Days to expiration (DTE): 72

Below is the chart as at close of 3-Sep:


This the P&L Chart as at close of 3-Sep:

Related Posts:

Details:
Buy N225 October 17625 Call at 35 (Delta: 0.0792)
Sell N225 October 17375 Call at 50 (Delta: 0.1187)

N225 at 16274.20 (~1100 points upside)

Credit received : 20 (JPY 20,000)
Max risk: 230 (JPY 230,000)
Margin: JPY 100,000
ROM: 20%
Days to expiration (DTE): 55


November 2014 K200 Put Spread

Sep-3, I sold an K200 Put Spread 242.5/245 when K200 was at 262.26.

Details:
K200 at 262.26 (~17 points downside)

Sell K200 October 245 Put at 0.78 (Delta: 0.1061)
Buy K200 October 242.5 Put at 0.59 (Delta: 0.0854)


Credit received : 0.19 (KRW 95,000, before commission)
Max risk: 2.31 (KRW 1,155,000)
Margin: KRW 1,000,000
ROM: 9.5%
Days to expiration (DTE): 72

Below is the chart as at close of 3-Sep:


This the P&L Chart as at close of 3-Sep:

Related Posts:
Sep-4: November 2014 K200 Iron Condor

Close October 2014 K200 Call Spread of Iron Condor

Sep-3, I closed the K200 October 2014 Call Spread of Iron Condor 247.5/250/277.5/280.

Details:
Sell K200 October 280 Call at 0.12
Buy K200 October 277.5 Call at 0.18

Note: All calculation before commission
Credit received : 0.21 (KRW 105,000)
Credit paid : 0.06 (KRW 30,000)
Profit : 0.15 (KRW 75,000), 71% of Credit
Margin : ~KRW 1,000,000 for full Iron Condor
Return On Margin (ROM) : 7.5% or 15% for full Iron Condor or half Iron Condor respectively
Days on Trade : 14


This the P&L Chart with Put Spread left as at 3-Sep Closed:
Sell K200 October 250 Put at 0.76 (Delta: 0.1193)
Buy K200 October 247.5 Put at 0.56 (Delta: 0.0907)


Related Posts:
Aug-26: October 2014 K200 Iron Condor

Monday, September 1, 2014

Close October 2014 N225 Put Spread of Iron Condor

On 1-Sep, I closed the N225 October 2014 Put Spread of Iron Condor 13250/13500/16500/16750.

Details:
Buy N225 October 13500 Put at 18
Sell N225 October 13250 Put at 14

Note: All calculation before commission
Credit received : 15 (JPY 15,000)
Credit paid : 4 (JPY 4,000)
Profit : 11 (JPY 11,000), 73% of Credit
Margin : ~JPY 100,000 for full Iron Condor
Return On Margin (ROM) : 11% or 22% for full Iron Condor or half Iron Condor respectively
Days on Trade : 21

This the P&L Chart with Call Spread left:
Buy N225 October 16750 Call at 14 (Delta: 0.0776)
Sell N225 October 16500 Call at 40 (Delta: 0.1012)

October 2014 N225 Iron Condor

On 12-Aug, I sold an N225 Iron Condor 13250/13500/16500/16750 when N225 was at 15145.33.

Details:
Buy N225 October 16750 Call at 26 (Delta: 0.0776)
Sell N225 October 16500 Call at 40 (Delta: 0.1012)

N225 at 15145.33 (~1355 points upside; 1645 points downside)

Sell N225 October 13500 Put at 65 (Delta: 0.0875)
Buy N225 October 13250 Put at 50 (Delta: 0.0587)


Credit received : 29 (JPY 29,000, before commission)
Max risk: 221 (JPY 221,000)
Days to expiration (DTE): 59

Below is the chart at close of 12-Aug:

Related Posts:

Credit received : 29 (JPY 29,000)
Credit paid : 59 (JPY 59,000)
Loss : 30 (JPY 30,000), 103% of Credit
Margin : ~JPY 100,000 for full Iron Condor
Return On Margin (ROM) : 30% 
Days on Trade : 39

Monday, August 25, 2014

October 2014 K200 Iron Condor

On 21-Aug, I sold an K200 Iron Condor 247.5/250/277.5/280 when K200 was at 263.39.

Details:
Buy K200 October 280 Call at 0.40 (Delta: 0.0797)
Sell K200 October 277.5 Call at 0.61 (Delta: 0.1161)

K200 at 263.39 (~14 points upside; 13 points downside)

Sell K200 October 250 Put at 0.76 (Delta: 0.1193)
Buy K200 October 247.5 Put at 0.56 (Delta: 0.0907)


Credit received : 0.41 (KRW 205,000, before commission)
Max risk: 2.09 (KRW 1,045,000)
Days to expiration (DTE): 49

Below is the chart at close of 21-Aug:


Below is how the trade looks like today, 26-Aug:

Related Posts:
Sep-3: Close October 2014 K200 Call Spread of Iron Condor
Sep-19: Close October 2014 K200 Put Spread of Iron Condor

Credit received : 0.41 (KRW 205,000)
Credit paid : 0.10 (KRW 50,000)
Profit : 0.31 (KRW 155,000), 75% of Credit
Margin : ~KRW 1,000,000
Return On Margin (ROM) : 15.5% 
Days on Trade : 30

Tuesday, March 18, 2014

A Good Trade That Went Wrong?

Is this a good trade that went wrong?

Day 1: 12-Mar-2014 N225 : 14853 (-370 or -2.43%)

I have been waiting for this big drop (>2% drop) for many days/weeks.  Implied Volatility (IV) has shot up (somehow I didn't capture all the IV.  will need to find out where else I can get it).  I immediately sold a Iron Condor with good credit of 40 points.


Implied Volatility :
Iron Condor (40 credit : JPY 400,000, ROM 53%)
10 N225 16000/16250 Bear Call Spread (Delta 11.43/7.23) : 20
10 N225 13500/13250 Bull Put Spread (Delta 12.80/9.47) : 20


Day 2: 13-Mar-2014 N225 : 14816 (-13.74 or -0.09%)


Implied Volatility :
Iron Condor (46 credit) : Loss of 6 pt (JPY 60,000)
10 N225 16000/16250 Bear Call Spread (Delta 10.89/6.85) : 23
10 N225 13500/13250 Bull Put Spread (Delta 11.65/8.51) : 23


Day 3: 13-Mar-2014 N225 : 14327.18 (-488.80 or -3.30%)


Implied Volatility :
Iron Condor (53 credit) : Loss of 13 pt (JPY 130,000)
10 N225 16000/16250 Bear Call Spread (Delta 4.53/2.80) : 8
10 N225 13500/13250 Bull Put Spread (Delta 24.94/19.16) : 45

The drop of 488.80 points (or 3.30%) is making this Iron Condor very uncomfortable.  Delta is almost 25, which is my adjustment trigger point (Don't let Deltas go over 25 to 30).  And N225 is only 827 points away from the Short Put Strike of 13500.


Day 4: 17-Mar-2014 N225 : 14277.52 (-50.14 or -0.35%)


Implied Volatility :
Iron Condor (48 credit) : Loss of 8 pt (JPY 80,000)
10 N225 16000/16250 Bear Call Spread (Delta 3.97/2.49) : 8
10 N225 13500/13250 Bull Put Spread (Delta 24.65/18.20) : 40

I decided to adjust : taking the 8pt loss and open a new Iron Condor.

Iron Condor (34 credit : JPY 340,000, ROM 45%)
10 N225 15500/15750 Bear Call Spread (Delta 10.18/6.44) : 17
10 N225 12750/12500 Bull Put Spread (Delta 10.02/7.38) : 17

Day 5: 18-Mar-2014 N225 : 14409.43 (+131.76 or 0.92%)


Did I adjust too early?


Friday, January 10, 2014

K200 Jan 09 Expiration

These are my trades for K200 09Jan14 contract.

The below chart is K200 Index Daily Chart as at 02-Dec.  Since the K200 was still climbing up with a higher high higher low, my view was still bullish.  However, I was not comfortable with the last swing low at 258.  I wanted a safer Strike lower.  Thus I picked the last resistance at 250.


I sold 5 contracts of K200 Vertical Spread 09Jan14 250.0/247.5 Put, receiving KRW 650,000.00 (before commission)


The below daily chart is as at 17-Dec.  When K200 hit pass the last swing low of 258, I wasn't too sure about my bullish view.  It is showing a lower high lower low now.


I wanted to perform adjustment to my position, however I am not too sure what to adjust.  Should I cut loss now but it still has 8 points before hitting my Short Strike at 250?  Should I roll?  This topic of adjustment is an important knowledge I need to acquire in the near future.  Anyhow, I did something.

The below Weekly chart is as at 13-Dec.  We can see that K200 is within the trading range of 230-272.50 for the last two years (2012-2013).  There is no Strike price for me to sell 230/227.5 Put Spread.  I decided to sell 272.5/270.0 Call Spread instead.  I wasn't aware that my position became Iron Condor when I sold the Call Spread.  Anyhow, this Iron Condor was in line with my Weekly trading range view.


This is the trade report for 272.5/275.0 Call Spread, which bring in KRW 275,000.00 (before commission).


The below daily chart is as at 27-Dec.  When I saw that K200 failed to break the resistance near 264, I am more convinced with my new bearish view.  I decided to sell another Call Spread.  And I don't think it even can go up beyond the last swing high at 270.


Thus, I took a trade of  Call Spread 270.0/272.5, with a credit of KRW 675,000.00 (before commission).  I wasn't aware that this 2.5pt Call Spread of 270.0/272.5 had combine with the previous 2.5pt Call Spread of 272.5/275.0 into a 5pt Call Spread of 270.0/275.0.  At the same time, it had make a realized profit of KRW 122,850.00 (USD 116.37) after commission.


The below daily chart as at 03-Jan 9.22am confirmed my bearish view.  K200 continued the big drop on 02-Jan and hit pass the last swing low of 255.5.  However, we were just 5 working days (including 03-Jan) away, I didn't think K200 will drop below 250 and 245.  Taking advantage of the high volatility in Put Options, I sold another 5 contracts of 250.0/247.5 Put Spread and 10 contracts of 245.0/242.5 Put Spread.


The additional 5 contracts of 250.0/247.5 Put Spread brought in additional KRW 550,000.00 (before commission) and the 10 contracts of 245.0/242.5 Put Spread brought in KRW 400,000.00 (before commission), totaled KRW 950,000.00 (before commission).


This is at Expiration on 9-Jan.  K200 closed at 253.63.


All contracts expired worthless.  I got to keep the full KRW 2,406,450.00 (USD 2,263.82) premium (after commission/fee) as profit.  With the realized profit, KRW 122,850.00 (USD 116.37), on 30-Dec, that will be KRW 2,529,300.00 (USD 2,380.19) for January.


Sunday, December 15, 2013

Second set of Live Trades

This is my second set of Live Trades, on Korea KOSPI 200 Index Option (K200).

After my first live trade on ES, I wanted some Options that are active during my day time (Singapore time).  And I ended trading KOSPI 200 Index Option.
(I will have another post explaining the various Asia Pacific exchanges Index Options or Futures Options that I explore.)

The below chart is K200 Index Daily chart as at 25-Nov.  I saw that K200 Index has been on uptrend since July.  October retracement stopped at about 258 before climbing up again.  I want a Strike price at July swing low of 230 or August swing low of 240 as the support.  But the premium for Put Option is so low that I cannot even create a Vertical Spread.

So, I chosen the nearest swing low on November of 258 as the support, which I was a bit worry (will elaborate more in subsequent post).  And I also enter a trade at the the last resistance in August of 250, hoping that the resistance will become a support.


I did two trades on K200 Index Option on two separate days:
25-Nov :  Sell 5 contracts of K200 Vertical Spread DEC12'13 257.5/255.0 Put
26-Nov : Sell 5 contracts of K200 Vertical Spread DEC12'13 250.0/247.5 Put

Order preview for K200 Vertical Spread DEC12'13 257.5/255.0 Put.  I forgot to create the image for Order preview for the 250.0/247.5 Put spread.


The below are the trades report.  As can be seen, the premium for 257.5/255.0 spread is KRW 450,000.00 (before commission), double of the 250.0/247.5 spread of KRW 225,000.00 (before commission).


I added another two contract of 257.5/255.0 on 6-Dec.  As you can see, the last few days drop paused at the shaded region where price was stalled in the last climb.  I expect the price to hold.  It seems to hold.  And the premium was attractive.  With just 2 contracts, the premium (KRW 400,000.00) collected is about the same as the 5 contracts I sold on 25-Nov (KRW 450,000.00).


This is at Expiration on 12-Dec.  K200 Index close at 259.05, touching low at 257.20.  All contracts expired worthless.  So, I got to keep the full KRW 1,065,690 (which is USD 1,013.49) premium (after commision/fee) as profit.


Sunday, December 8, 2013

Weekly Review

Trade 1 : Selling ASML Vertical Spread DEC2013 87.5/85 Put

ASML stop climbing up and drop to 91.45 last week close.  With another 2 weeks to close before expiration.  We will get to keep the full premium as long as ASML stay above 87.5.


Profit is just $30.  Let's continue to monitor for next 2 weeks.


Friday, November 29, 2013

First Live Trade

After about two months of testing in demo/paper account, I finally executed my first live trade using real money.  Instead of Equity/Stock Option, I traded Futures Option instead, specifically E-mini S&P 500 Futures Options (Symbol: ES)

There are many reasons why I choose ES over Stock Option.  Firstly, this is the Futures that I am trading daily.  I am looking at the chart, the numbers, everyday.  I am familiar with ES characteristic: what is the usual range, what is the support and resistance, etc.

Secondly, ES is traded almost 24 hours.  This solve the problem I have with US Stock Option.  To execute a trade for US Stock Option, I need to start trading at 9.30pm.  With Daylight saving now, it is 10.30pm.  I am not a night person.  Trading at that late hours didn't get my full attention, focus or energy.

Thirdly, ES has high liquidity, thus spread is narrow.  It also has both End-of-month and Weekly options.  There are many expiration dates you can choose.

Let me start with some guideline for Selling Put Spread first:

1. Expiration : up to one month
- as a seller of Put Spread, time decay is helpful to my position
- i want to give the party on the other side of this trade (buyer) as little time to be right as possible

2. Strike Price : OTM at support/resistance
- for a Short Put Spread to make maximum gain (the full credit received), I need the price to stay above the higher Strike price.
- the current price can go down a bit as long as it stay above the higher Strike price at expiration, we get to keep the full credit.
- so, I need to give the underlying asset some room to move up & down, but not below the higher Strike price
- therefore, the higher Strike price will be at strong support level.

3. Premium/Yield : 10%-20%
- for a 10 points (ES is price in points instead of dollars.  Each point is $50) spread, I need to get at least 1 point in premium
- I got this guideline/idea from a book, "Options made Easy" by Guy Cohen
- I will need to revisit this guideline as this is very different from Futures/Forex trading Risk:Reward ratio.  For 10% premium yield, it is basically risking 10 points ($500) for 1 point ($50) reward.  Risk:Reward ratio is 10:1.  This is really bad for Futures/Forex trading.  We would normally want to risk $1 to get $2 or $3 reward.

Let's look at some charts to help determine what Put Spread to sell.

This is ES monthly chart as at 1-Nov.  It is a clear uptrend since 2009 bottom.  It is up all time high.


This is ES weekly chart as at 1-Nov.  Again, a very clear uptrend.  The range of each week movement is about 40 points in the middle, with a high of about 80 points.


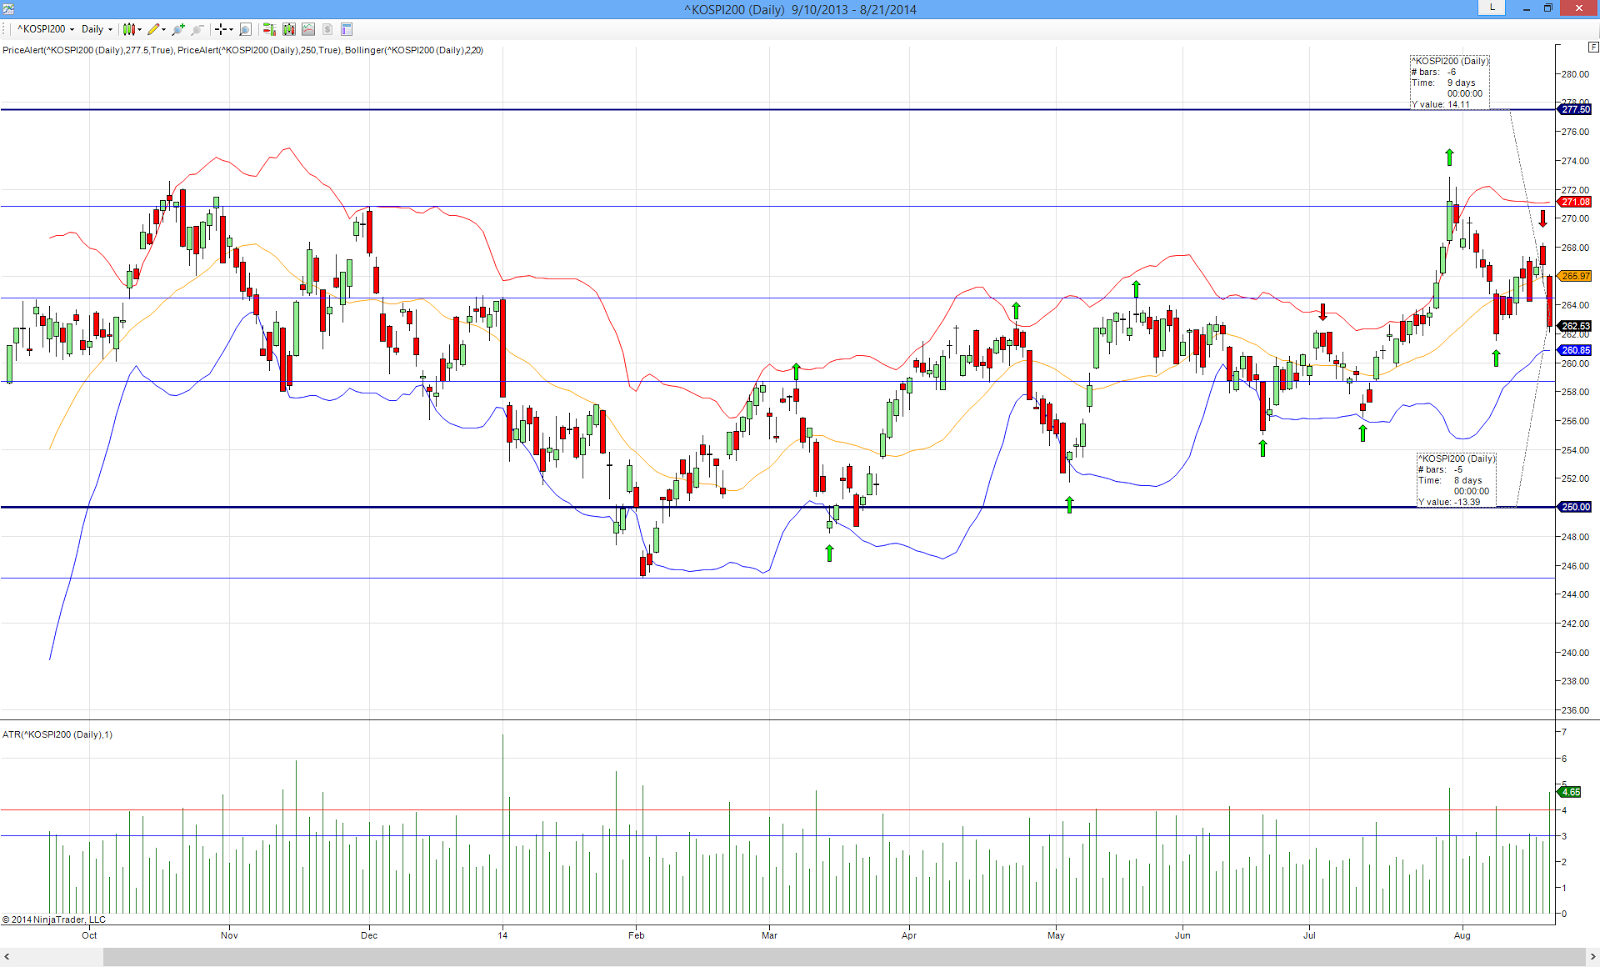
This is ES daily chart when I open my First Option position on 1-Nov.


Strike Price : OTM at support/resistance
- As you can see from the chart, the first support is 1726.75, that is about 28 points away from the current 1754.75.  It is too close for me to consider.  A weekly movement of 40 points could easily hit pass this first support.
- I wanted a safer support at 1640, which is >110 points away.
- Or at least at the support at 1700, which is 54 points away.  It is a second last swing which I think it should hold.

Expiration : up to one month And Premium/Yield : 10%-20%
- At 1640, I cannot find a premium that meet the guideline above.  That is to say, I cannot even get 10% yield with up to one month expiration.  Not attractive at all.
- I found one at 1700/1690, with expiration on 22-Nov, less than 1 month.  1 point premium with 10 point spread.


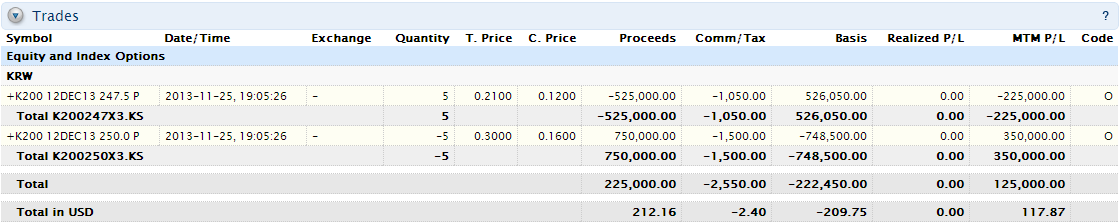
This is my trade on 1-Nov.


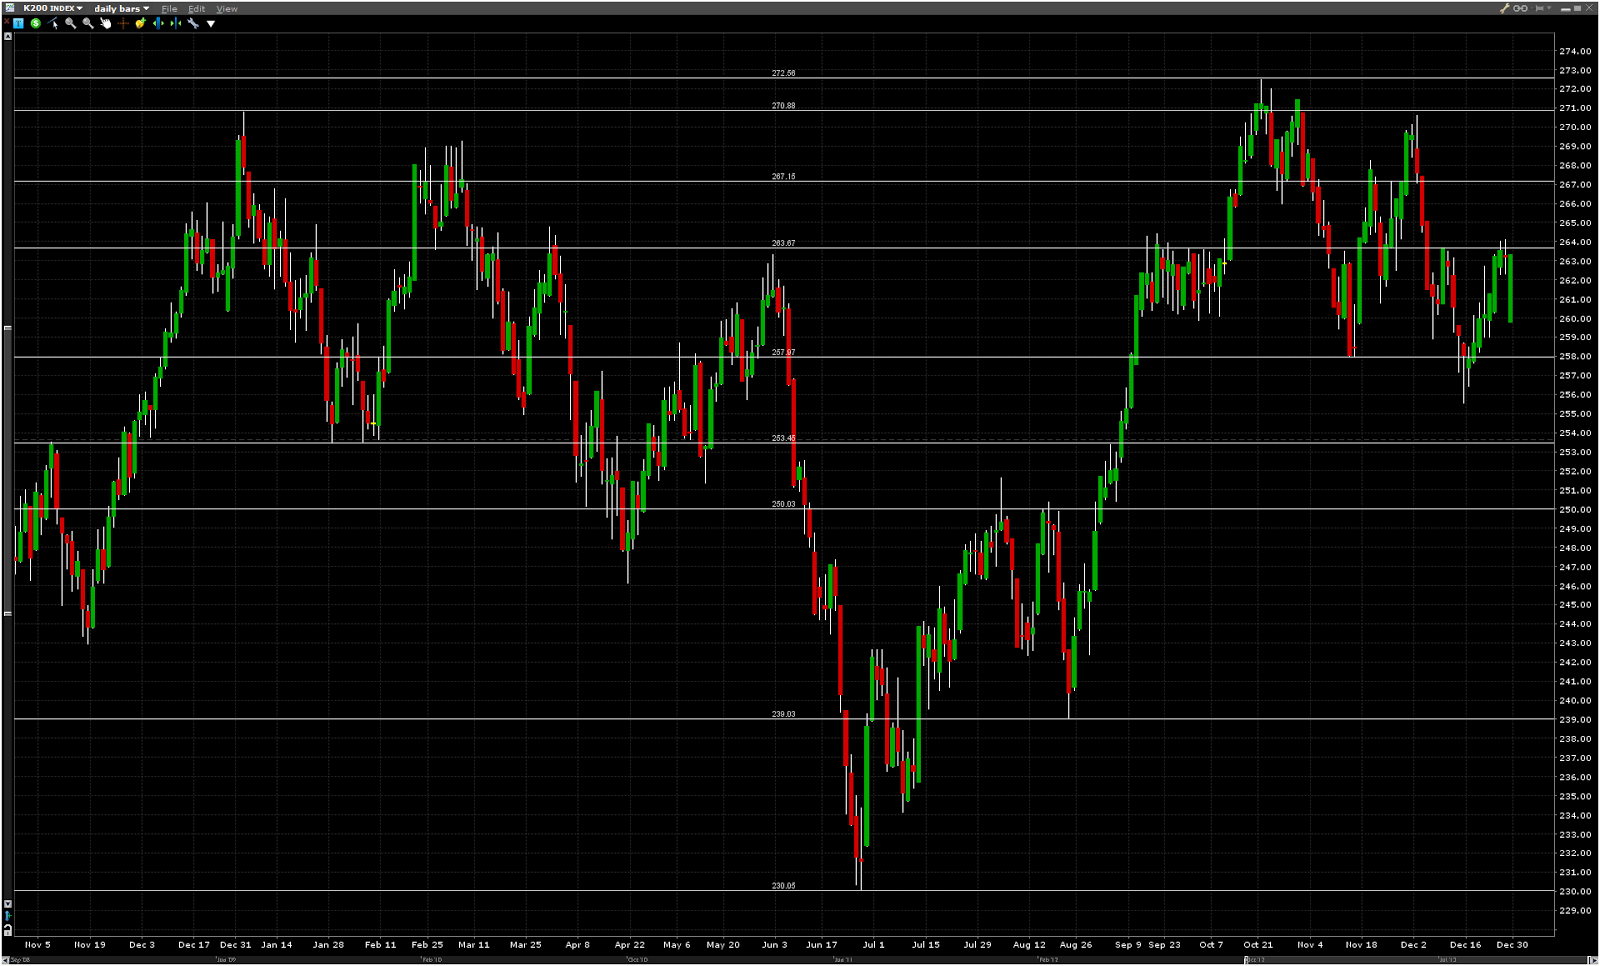
This is the daily chart as at 22-Nov.  Price didn't even fall below the first support line 1726.76.  It went all the way to 1736.50 before bouncing off.  This will add lots of stress for me if I really sell the Put Spread at 1725.  So, 1700/1690 Put Spread is easier to manage, at least for first trade.  But, of course, I will get a higher premium if I sold the 1725/1715 Put Spread.


This is at Expiration on 22-Nov.  So, no commission.


This is the Profit & Loss on 22-Nov.  $471.60, after commission.