Monday, August 25, 2014

October 2014 K200 Iron Condor

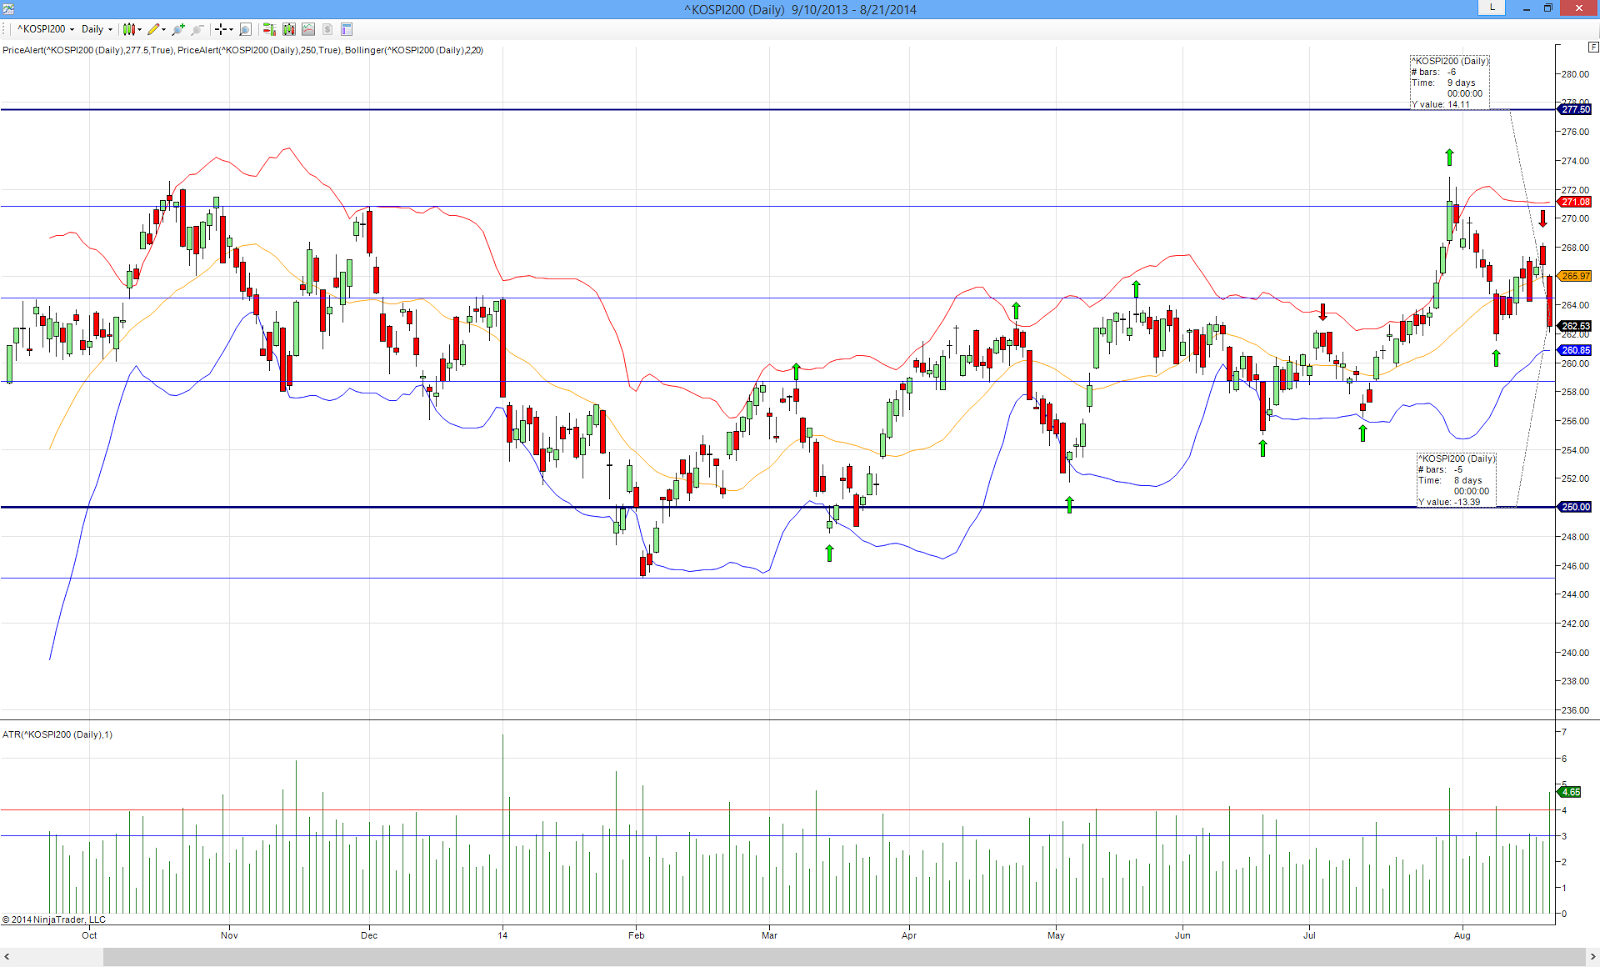
On 21-Aug, I sold an K200 Iron Condor 247.5/250/277.5/280 when K200 was at 263.39.

Details:
Buy K200 October 280 Call at 0.40 (Delta: 0.0797)
Sell K200 October 277.5 Call at 0.61 (Delta: 0.1161)

K200 at 263.39 (~14 points upside; 13 points downside)

Sell K200 October 250 Put at 0.76 (Delta: 0.1193)
Buy K200 October 247.5 Put at 0.56 (Delta: 0.0907)


Credit received : 0.41 (KRW 205,000, before commission)
Max risk: 2.09 (KRW 1,045,000)
Days to expiration (DTE): 49

Below is the chart at close of 21-Aug:


Below is how the trade looks like today, 26-Aug:

Related Posts:
Sep-3: Close October 2014 K200 Call Spread of Iron Condor
Sep-19: Close October 2014 K200 Put Spread of Iron Condor

Credit received : 0.41 (KRW 205,000)
Credit paid : 0.10 (KRW 50,000)
Profit : 0.31 (KRW 155,000), 75% of Credit
Margin : ~KRW 1,000,000
Return On Margin (ROM) : 15.5% 
Days on Trade : 30

Saturday, August 23, 2014

Weekly Market Reivew HSI

I have decided to stop exploring HSI Option trading for the following reasons:

1. Low volume for next month contract (covered in this post)
- I normally enter a trade 6-8 weeks before expiration.  That means, I don't really trade current month contract.  I trade the next month or next next month contract.
- the low Open Interest in next month (worst in next next month) contract is the main reason I don't want to force myself into trading HSI Option.

2. All the reasons cover in previous review here.

Therefore, I will stop cover HSI with immediate effect and focus back on N225 and K200.

Weekly Market Reivew K200

K200 closed at 264.26 on Friday, 22-Aug-2014, lost 1.62 (0.61%) over the last 5 trading days.


While K200 seems not to move much during this week, it did has a big drop of 4.26 points on Thursday.  This result a spike in volatility which provide an opportunity of trade.

Looking at the bigger picture on daily chart, we now have a lower high on Wednesday.  Will we get a lower low?


Looking at the Weekly and Monthly chart, it is still a inside bar.  We need more data in the coming weeks to tell us where K200 is heading.


Weekly Market Reivew N225

N225 closed at 15,539.19 on Friday, 22-Aug-2014, gained 220.85 (1.44%) over the last 5 trading days.  NKVI lost 0.31 (1.72%) ending the week at 17.69.


Looking at the bigger picture on daily chart, N225 broke through the tight range of 15,000-15,500 on Thursday.  It held above it on Friday.  We need to see if N225 can stay above 15,500 next week or if it fall back to the tight range, to give us a clear idea where it is heading.  Of course, a break of its previous high at 15759.66 is a bullish move.


Looking at the weekly chart, N225 took two weeks to recover all its loss in that knee jerk reaction week.  It is now back above the tight range of 15,000-15,500.


Looking at the monthly chart, the long pin bar which was red has turned green.  This is bullish.  With only 220 points away from last month high, it will be even more bullish if it can break it with the remaining 5 trading days.


NKVI didn't move much this week.  It seems like we are back to low volatility.  If we wait for mean reverting of volatility to trade, we could be waiting for a long time.  Need to figure out how to trade in this low volatility.


SPX broke another record high (depite with just 4 points) on Thursday.  It closed at 1988.40, down 3.97 points on Friday.  This won't have much effect on N225 when it opens on Monday.

Saturday, August 16, 2014

Weekly Market Reivew HSI

HSI closed at 24,954.94 on Friday, 15-Aug-2014, gained 623.53 (2.56%) over the last 5 trading days.


Looking at the Weekly/Monthly chart, not much changes.  HSI broke 25,000 briefly on Friday but didn't close above that.  We need to see if it can stay above 25,000 in the coming week.


Weekly Market Reivew K200

K200 closed at 265.88 on Thursday, 14-Aug-2014 (KRX was closed on Friday), gained 3.86 (1.47%) over the last 4 trading days.


K200 didn't recover as strong as N225 on Monday.  In fact, it was an inside bar on Monday.

Looking at the bigger picture on daily chart, not much has changed.  The uptrend is still not broken.  K200 is back above 264.50.  This is the same for Weekly chart and Monthly chart.


Weekly Market Reivew N225

N225 closed at 15,318.34 on Friday, 15-Aug-2014, gained 539.97 (3.65%) over the last 5 trading days.  NKVI lost 5.25 (22.58%) ending the week at 18.00.


Last Friday 454 points drop was really a knee jerk reaction to the geopolitical uncertainty.  N225 opened strongly (352 points) on Monday back above 15,000.  However, in the next four days, it was trapped in the same 15,000-15,500 tight range it used to be.


Looking at the bigger picture on daily chart, N225 not only go back to the previous tight range of 15,000-15,500, it is also in the middle of Bollinger Band. While Thursday high could theoretically be considered as lower high (since Friday high is lower than Thursday high), I would rather wait for Monday to decide as Friday high is just about 10 points lower.  Let's see.


Looking at the weekly chart, N225 is back again to the 15,000-15,500 tight range.  It is also an inside bar.  Thus, no clear indication where it is heading.  We just have to wait and see.


Looking at the monthly chart, N225 is still on the uptrend.  This month bar is a long pin bar.  If it manage to close higher than last month high (which is about 450 points away), it will be a bullish pin bar.  We may see N225 continues its climb.  However, if it close below 15,000, then we have a lower high.  We could be in a reverse trend or at least pause of up trend.  Let's see.


NKVI dropped 22.58% this week after N225 recovered from its knee jerk reaction.  So if you have sold a Put Bull Spread when the volatility is at 23, your Put Bull Spread will have a big gain when volatility drop back to 18 this week.  Not to mentioned the recovery of N225 will put the Delta in your favour.

Anyhow, we are again back to the low volatility of below 20.  We just have to trade with caution.  Any mean reverting of volatility is bad to our option selling.


SPX closed at 1955.06, dwon 0.12 points on Friday.  This won't have much effect on N225 when it opens on Monday.


Saturday, August 9, 2014

Weekly Market Reivew HSI

HSI closed at 24,331.41 on Friday, 8-Aug-2014, lost 201.02 (0.82%) over the last 5 trading days.


Looking at the Weekly chart, not much changes.  This week just seem to be a pause.  25,000 seems to be a strong resistance.  And we are still on a short term uptrend.  Same for Monthly chart.


Weekly Market Reivew K200

K200 closed at 262.02 on Friday, 8-Aug-2014, lost 6.54 (2.44%) over the last 5 trading days.


This knee jerk reaction drop on Friday only restrict to Asian stocks.  SPX in fact close 22 points up on Friday.  We need the next few days to see if there is more weakness in K200.

KSE will be closed for trading on Friday, 15-Aug.  Thus, this will be a short week for K200.

Looking at the bigger picture on daily chart, the uptrend is still not broken.  We do not have a lower low.  And we do not have a lower high.  This is the same for Weekly chart and Monthly chart.


Weekly Market Reivew N225

N225 closed at 14,778.37 on Friday, 8-Aug-2014, lost 744.74 (4.80%) over the last 5 trading days.  NKVI gained 6.46 (38.48%) ending the week at 23.25.


N225 not only failed to hold 15,500, it fall through the 15,000, all within 5 trading days.  The single day drop on Friday is a whopping 454 points, close to 3% (2.98%).  This could be a simple knee jerk reaction to the geopolitical uncertainty.  Or could it be more, something else?


Looking at the bigger picture on daily chart, this week drop definitely gives a pause/stop to N225 past weeks uptrend move.  We have a clear lower low.  If we get a lower high, especially below 15,000, we might simply have a trend change, at least short term.  And there is nothing in between till the next round number support at 14,000.  Let's see.


In last week post, I mentioned about the long pin bar could be a false break.  My concern seems valid.  This week long red bar break through the 15,500 - 15000 range decisively.  If it continues its downward move, we are looking at 13,900-14,000 range for support.


NKVI gained a whopping 38.48% gain for the past week.  This put NKVI back to mid twenties.  And this stops (at least temporary) my concern/worry of the repeat of end 2012 long rally.


It seems that mean reverting for volatility is working.  We are back to the 20-30 range for 5 year chart.


SPX closed at 1931.59, up 22.02 points on Friday, despite a big sell off in Asian stock.  This should at least give a pause/stop to the big decline for N225 when it opens on Monday.


Saturday, August 2, 2014

Weekly Market Reivew HSI

HSI closed at 24,532.43 on Friday, 1-Aug-2014, gained 347.03 (1.43%) over the last 5 trading days.


Looking at the Weekly chart, we still have a bullish bar despite with a fairly long tail/wick. 25,000 seems to be a strong resistance.  Nevertheless, we are clearly on a short term uptrend.


From Monthly chart, nothing much has changed.  We will just have to watch 25,000 for upside breakout.


Weekly Market Reivew K200

K200 closed at 268.56 on Friday, 1-Aug-2014, gained 5.09 (1.93%) over the last 5 trading days.

As you can see from the chart, the first 3 days were almost a straight line up.  Each day gain was more than 2 points, with the 3rd day more than 3 points!

This week is a rare strong week for K200.  If not for the S&P500 2% drop, it might went up even higher.  In fact, the drop following S&P500 2% dop is only mere 0.55% drop.


In last week post, I mentioned that K200 has room to go towards 267-268.  It not only shot past 267-268, it even break the high October 2013.  It in fact end exactly at 272.83 as April 2012.  This seems to be a strong resistance.  If this is broken, then K200 will be heading to 295!


Weekly Market Reivew N225

N225 closed at 15,523.11 on Friday, 1-Aug-2014, gained 65.24 (0.42%) over the last 5 trading days.  NKVI gained 2.01 (13.60%) ending the week at 16.79.


N225 finally broke above 15,500 on Monday and has been staying above 15,500 for the whole week.  Even on the day after S&P500 2% drop, it didn't go below 15,500.


Looking at the bigger picture on daily chart, it is a clear break from the tight range of 15,000 - 15,500, with very clear higher high.  The next resistance seems to be 15,800, 16,000.


On the Weekly chart, it didn't look as good.  While N225 has broken above 15,500, it ends with a long pin bar.  If next week, it falls back below 15,500, this is a false break.  Thus, the next week bar is important to tell us more where it is heading.


NKVI gained quite a fair bit (percentage gain 2%) for the past week.  It seems that volatility is returning.


However, let's not forget, on a 5 year chart, we are still in a very low volatility environment.


I noticed something unusual for the past few days.  NKVI went up with N225.  Normally, NKVI is inversely correlated to N225.  That is, NKVI goes up when N225 goes tdown; NKVI goes down when N225 goes up.


Such situation happened in end 2012 when N225 climb from 8,500 to 11,500 and NKVI climb from 17+ to 29+.  Need to monitor this situation closely so that I will adjust my strategy accordingly.


SPX closed at 1925.15, down 5.52 points on Friday.  As posted in this post, SPX has 2% 4 times this year.  In the past 3 times, they were just correction before uptrend resume again.


N225 might follow with a down day when open on Monday.